
It is however not possible to guarantee the accuracy, completeness or timeliness of the information. Our content is not intended to be used as a legal, investment or financial advice and should not be construed or relied on as such. We do not give investment advice. Cryptocurrency investments are not supervised by any EU regulatory framework. Any decisions related to investments are made by the user alone. Please always note that the crypto market is subject to high volatility. Tags: Ripple (XRP) Price Enjoy reading? Share with your friends Facebook Twitter LinkedIn Telegram About The Author Crypto VizArt More posts by this author Full-time on-chain Data Analyst and Python Programmer. Passionate about Bitcoin and DataVisualization. Contact: TwitterIt is however not possible to guarantee the accuracy, completeness or timeliness of the information. Our content is not intended to be used as a legal, investment or financial advice and should not be construed or relied on as such. We do not give investment advice. Cryptocurrency investments are not supervised by any EU regulatory framework. Any decisions related to investments are made by the user alone. Please always note that the crypto market is subject to high volatility.
The cryptocurrency market has been on a wild ride over the past few months, with Bitcoin and other altcoins experiencing significant price fluctuations. One of the top performers in this market has been Ripple (XRP), which has seen a surge in value in recent weeks. However, the coin is now approaching a key resistance zone, which could potentially limit its current uptrend.
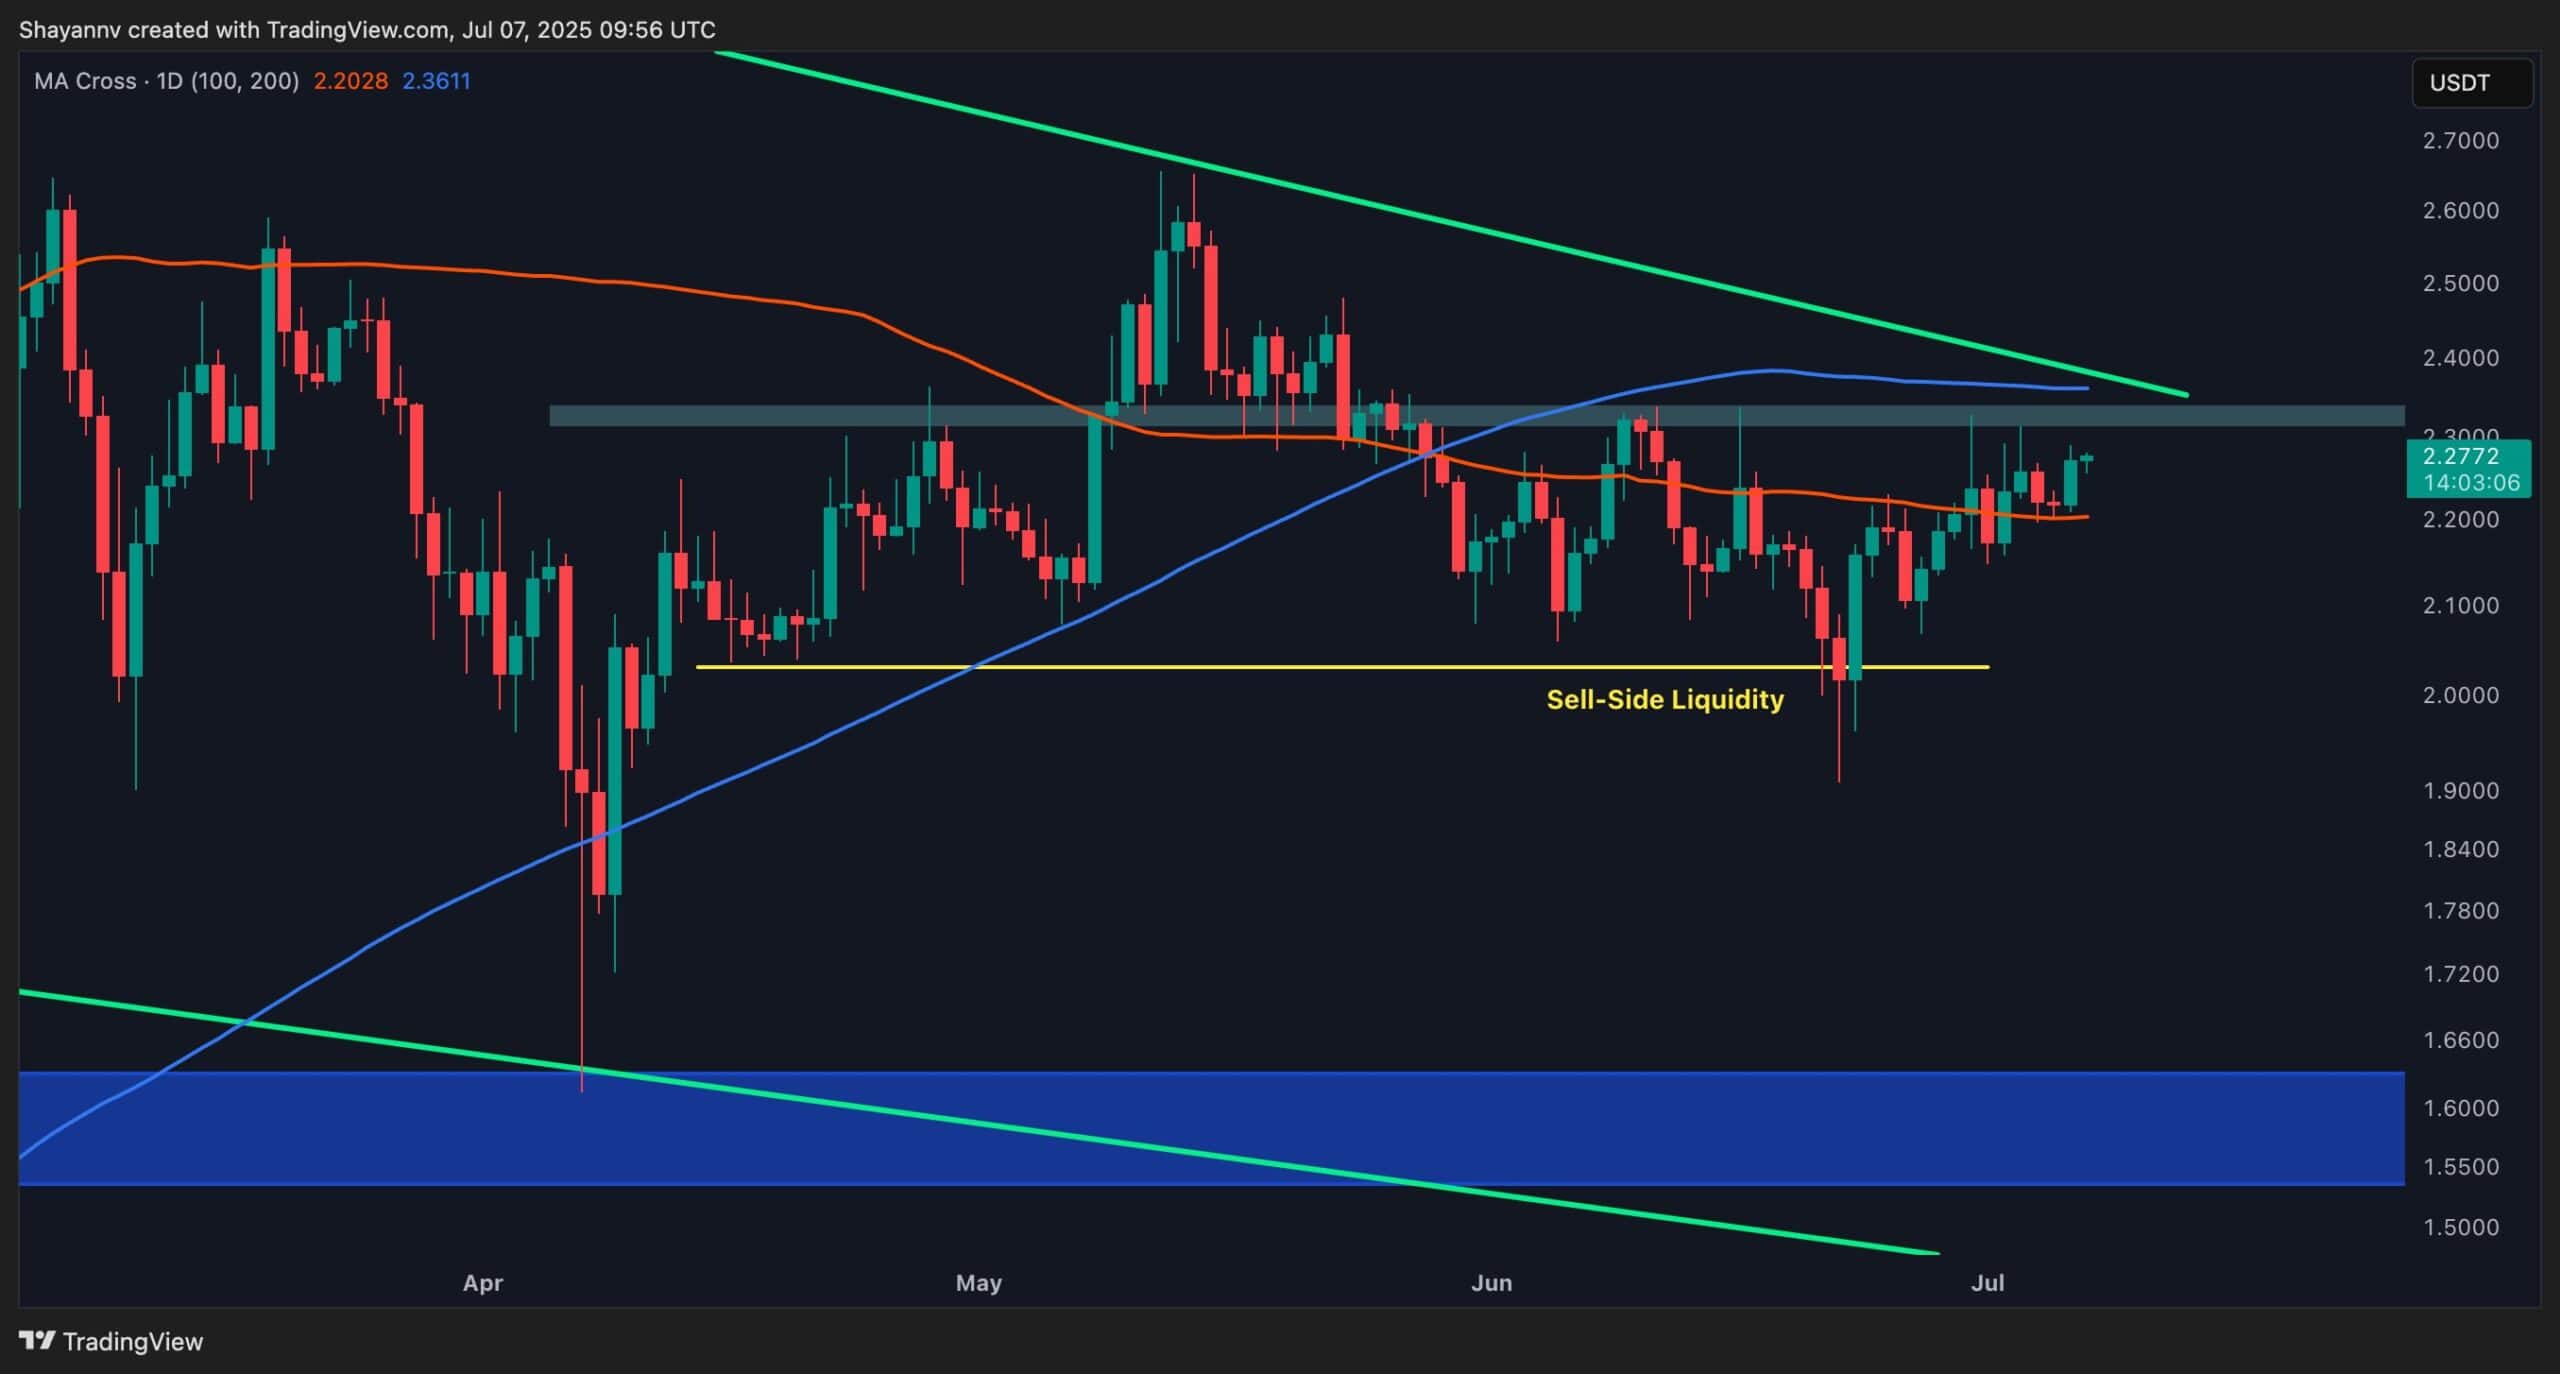
According to analysis by Shayanmarkets, the daily chart for XRP shows that the coin has broken above its 100-day moving average at $2.2 and completed a successful pullback. It has now entered a decisive range between the 100-day and 200-day moving averages, indicating potential consolidation. However, it is approaching a substantial resistance zone between $2.3 and $2.35, which aligns with the 200-day MA at $2.36 and the upper boundary of a prolonged descending wedge pattern.
This confluence of technical resistance is expected to act as a strong barrier, potentially halting the current uptrend. A rejection from this level could initiate a corrective move, but if the asset manages to break above this region, it could spark a fresh rally targeting the $2.5 psychological resistance.
On the 4-hour chart, Ripple has been steadily climbing within an ascending price channel, recently finding support at the $2.2 zone, the channel’s lower boundary. The price is now approaching the long-standing $2.3 resistance level, which has historically capped upside moves. A valid breakout above this range is essential to shift the market structure bullishly. However, based on current price behavior and historical rejections at this level, a pullback or consolidation is the more likely short-term scenario.
In conclusion, Ripple is approaching a critical resistance zone between $2.3 and $2.35, which could limit its current uptrend. The price action at this level will be decisive in determining XRP’s next major move. A rejection could initiate a corrective move, while a breakout could spark a fresh rally towards the $2.5 psychological resistance. Traders should closely monitor the price action at this level to make informed trading decisions.
Source:Read More