
Source: Tony Dante
Understanding ROIC and WACC
Before diving into the specific performance of International Seaways, Inc. (NYSE:INSW), it is crucial to understand the two key metrics mentioned – Return on Invested Capital (ROIC) and Weighted Average Cost of Capital (WACC). ROIC is a profitability ratio that measures how effectively a company uses its capital to generate profits. It is calculated by dividing net income by the total capital invested.
On the other hand, WACC represents a firm’s average after-tax cost of capital from all sources, including stocks, bonds, and other forms of debt. A lower WACC indicates that a company incurs less cost to finance its operations, which can be advantageous in competitive markets.
The ROIC to WACC ratio thus becomes an essential metric to assess a company’s financial health and operational efficiency. A ratio greater than 1 implies that a company generates returns exceeding its cost of capital, which is positive from an investment standpoint.
International Seaways’ Capital Efficiency
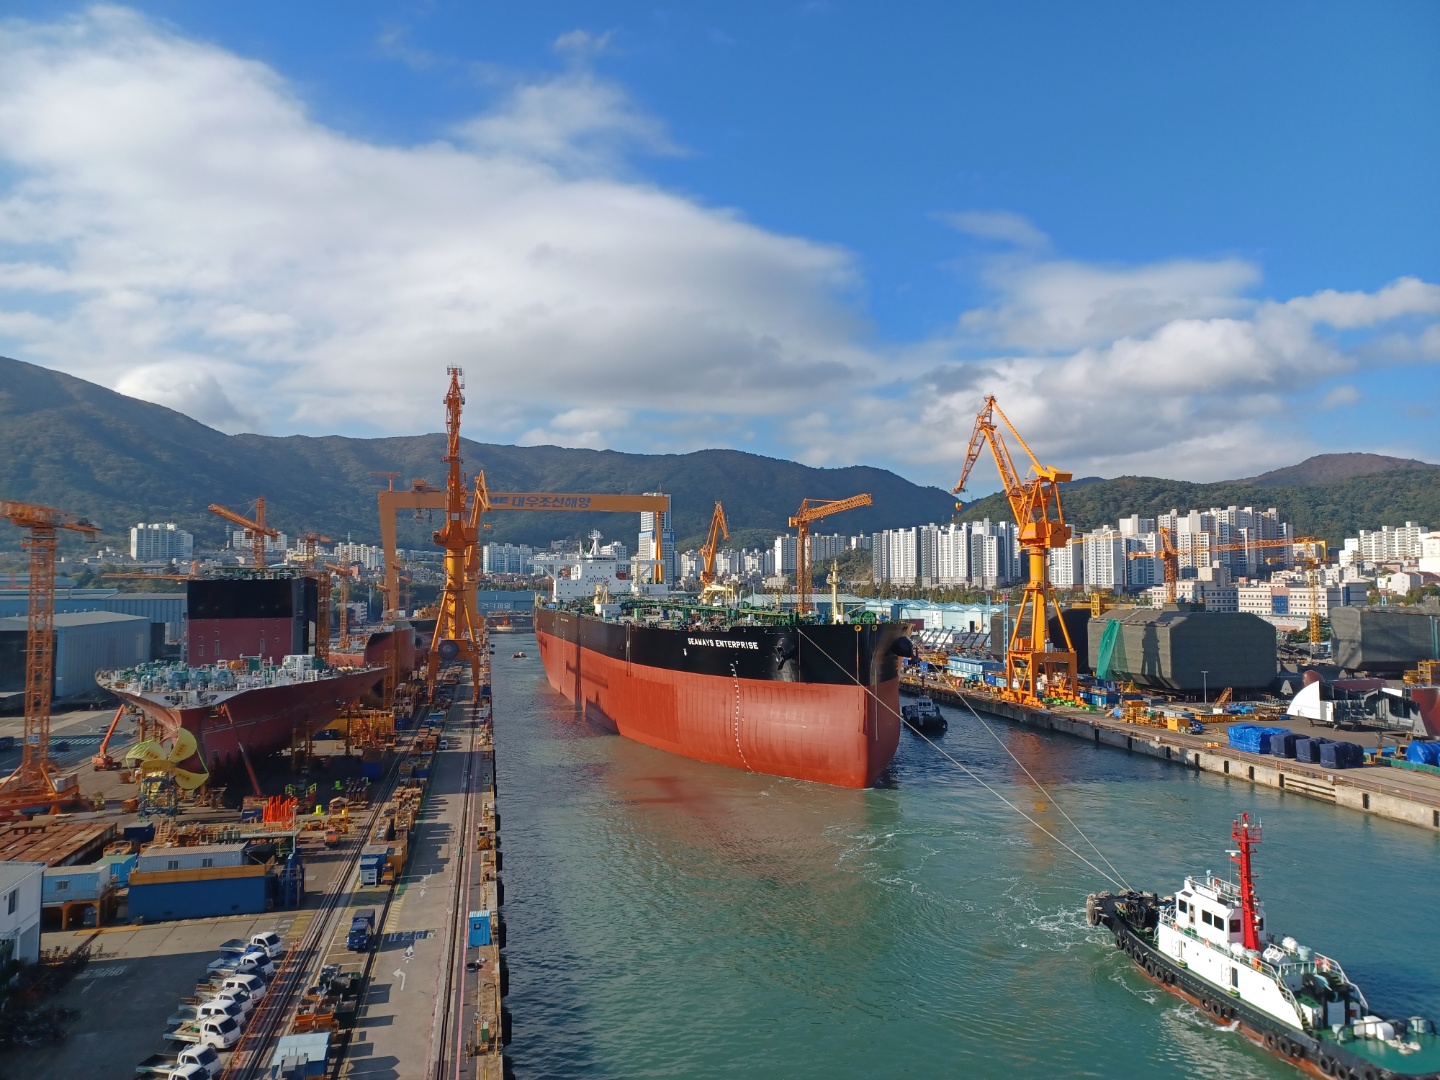
International Seaways, Inc. (NYSE:INSW), a leading player in the global shipping industry, specializes in transporting crude oil and petroleum products across the globe. With a diverse fleet of vessels, INSW ensures efficient energy resource delivery in a highly competitive market.
INSW’s ROIC stands at a healthy 8.85%, while its WACC is at 5.07%. This culminates in a ROIC to WACC ratio of 1.75, demonstrating that the company is effectively utilizing its capital and generating returns above its cost. This positive ratio is a favorable indicator for potential investors as it suggests that INSW is generating a higher return on its invested capital than it costs the company to raise this capital.
Comparison with Industry Peers
When benchmarking INSW’s performance against its peers, it provides a more comprehensive picture of the company’s capital efficiency.
Scorpio Tankers Inc., for instance, shows a ROIC of 8.01% and a WACC of 6.13%, resulting in a ROIC to WACC ratio of 1.31. This means that while Scorpio Tankers is also generating returns above its cost of capital, it lags behind INSW regarding capital efficiency.
Euronav N.V., another industry peer, exhibits a higher ROIC of 18.03% against a WACC of 6.98%, achieving a ratio of 2.58. This demonstrates a superior performance in terms of returns on invested capital, surpassing both INSW and Scorpio Tankers.
Ardmore Shipping Corporation, with a ROIC of 10.33% and a WACC of 5.38%, leads to a ratio of 1.92, placing it ahead of INSW and Scorpio Tankers but behind Euronav N.V.
Outperforming and Underperforming Peers
Teekay Tankers Ltd. emerges as the industry leader, boasting a ROIC of 12.88% and a WACC of 4.77%, culminating in the highest ROIC to WACC ratio of 2.70 among the group. This suggests that Teekay Tankers is utilizing its capital more efficiently than its peers, which can be an attractive proposition for investors looking for efficient capital use.
On the other end of the spectrum, Dorian LPG Ltd. demonstrates a ROIC of 4.18% and a WACC of 6.25%, with a ratio of 0.67. This indicates that Dorian LPG is generating returns below its cost of capital, which is a potential red flag for investors as it suggests the company is not efficiently using its capital.
Conclusion
The analysis of the ROIC to WACC ratio provides valuable insights into a company’s ability to generate returns above its cost of capital. While INSW showcases a positive ratio, indicating efficient capital utilization, it’s important for investors to consider this ratio in comparison with industry peers for a more comprehensive understanding of a company’s performance and potential investment value.